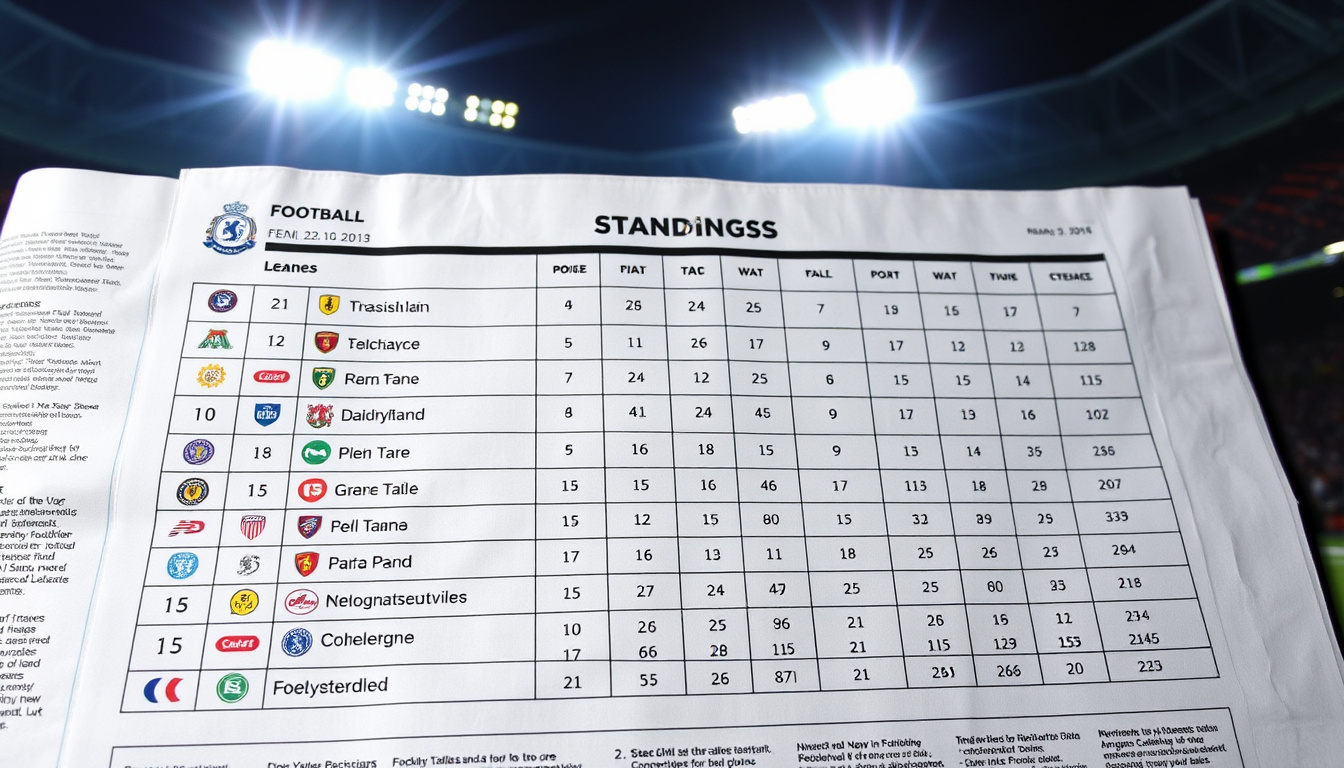
A league table serves as the definitive record of how football teams perform throughout a season. Whether tracking the Premier League or local competitions, these standings provide fans, analysts, and clubs with a clear snapshot of competitive progress.
Understanding how league tables work helps fans follow the beautiful game with deeper appreciation. From points allocation to tiebreaker rules, these systems apply consistently across most professional football competitions worldwide.
This guide explains everything you need to know about reading and interpreting league tables, with practical examples from the Premier League and other major competitions.
What Is a League Table?
A league table, also called standings or a points table, ranks football teams based on their performance throughout a competitive season. Teams earn points for results, with the highest-ranked team declared champion at season’s end.
The system originated in English football during the 1870s and has since become the standard method for determining competitive hierarchies across virtually all football leagues globally. Modern league tables update in real time following each match.
A ranking system that orders teams by points earned during a season
Played (Pld), Wins (W), Draws (D), Losses (L)
3 points for a win, 1 for a draw, 0 for a loss
Goal difference, goals scored, head-to-head record
Key Insights
- The three-point win system became standard in 1994, replacing the previous two-point reward
- Goal difference serves as the primary tiebreaker when teams level on points
- Most professional leagues update tables immediately after matches conclude
- Home and away fixtures each team plays 19 matches in a 38-game Premier League season
- Promoted and relegated teams transfer between league levels based on final positions
- Six clubs have remained ever-present in the Premier League since 1992: Arsenal, Chelsea, Everton, Liverpool, Manchester United, and Tottenham
- Manchester United leads with 13 Premier League titles since the competition’s formation
Common Terms Explained
| Term | Meaning | Example |
|---|---|---|
| Pld | Matches played | 38 |
| W | Wins | 28 |
| D | Draws | 6 |
| L | Losses | 4 |
| GF | Goals For | 73 |
| GA | Goals Against | 32 |
| GD | Goal Difference | +41 |
| Pts | Total Points | 90 |
How Is a League Table Calculated?
League tables derive their rankings from a straightforward points system. Teams receive three points for every win, one point for draws, and zero points for losses. This system provides a clear mathematical basis for comparing team performance regardless of when matches occur during the season.
Points Allocation
The point structure ensures that winning remains the primary objective while acknowledging that draws represent partial success. In a 38-match Premier League season featuring 20 teams, a team winning every match would accumulate 114 points.
Spreadsheet applications often calculate league statistics automatically using formulas that sum matches played, wins, draws, losses, goal difference, and points. The premierleague.com official website provides live updating tables that reflect these calculations in real time.
Tiebreaker Hierarchy
When two or more teams finish with equal points, league tables apply a specific hierarchy to determine final positions. According to the Premier League handbook, the order of tiebreakers follows this sequence:
- Total points accumulated during the season
- Goal difference (goals scored minus goals conceded)
- Total goals scored by the team
- Head-to-head points earned between the tied teams
- Away goals scored in head-to-head matches between tied teams
Goal difference calculations include all goals scored and conceded across every match, not just the difference in results. A team winning 5-0 and losing 1-0 maintains the same goal difference as winning 3-0 twice.
Promotion and Relegation Impact
League tables directly determine which teams move between competition levels. The English football system demonstrates how standings affect club trajectories across four professional tiers.
| League Level | Teams | Promotion Spots | Relegation Spots |
|---|---|---|---|
| Premier League | 20 | Championship top 2 + playoff winner | Bottom 3 |
| Championship | 24 | Top 2 automatic + playoff (3rd-6th) | Bottom 3 |
| League One | 24 | Top 2 automatic + playoff | Bottom 4 |
| League Two | 24 | Top 3 automatic + playoff | Bottom 2 |
How Do You Read a League Table?
Reading a league table requires understanding each column’s purpose and how they interconnect to form the complete picture of a team’s season. Most tables present information in a standardized format that remains consistent across different competitions and broadcasters.
Understanding Each Column
The played column (Pld) shows total matches completed. A team in the Premier League typically plays 38 matches across a full season, though this number varies if matches are postponed or rescheduled.
W, D, and L columns display win, draw, and loss totals respectively. These figures combine with points to reveal consistency patterns. A team with fewer losses but similar points to another demonstrates defensive strength.
Goal difference (GD) provides crucial context beyond raw win totals. According to Premier League official explanations, this calculation reveals whether teams win convincingly or narrowly. Two teams with identical points but different goal differences often have distinct tactical approaches.
Position Changes and Weekly Updates
League tables change after every scheduled match, sometimes multiple times within a single day during busy fixture periods. Teams can rise or fall several positions depending on results across the league.
The BBC Sport platform updates standings in real time, allowing fans to track positional changes throughout matchdays. Form guides showing recent results often accompany tables to indicate momentum.
Some analytical platforms calculate effective matches played (ePld) to account for fixture difficulty. This approach adjusts rankings for teams facing tougher schedules, revealing teams with “games in hand” that might climb the table once fixtures equalize.
The History of League Tables
League table systems evolved alongside organized football competitions in England during the late nineteenth century. The need for standardized record-keeping led to formal adoption of points-based standings that could compare teams across different match schedules.
- 1870s: Early English football leagues establish informal ranking systems based on matches won
- 1880s: Football League introduces consistent points allocation across all member clubs
- 1981: Goal difference replaces alphabetical ordering and goal average as primary tiebreaker in most leagues
- 1992: Premier League formation brings modern digital table technology and real-time updates
- 1994: Three-point win system adopted globally, replacing the previous two-point standard
- Present: Live digital tables and mobile applications provide instant access to evolving standings
The Wikipedia league table article documents how these systems spread from England to become the universal standard for competitive football worldwide.
Established Facts and Uncertainties
Understanding what league table rules are fixed versus variable helps fans appreciate the nuances across different competitions.
| Established (Standard) | Variable (League-Specific) |
|---|---|
| 3 points for win, 1 for draw, 0 for loss (FIFA standard since 1994) | Tiebreaker order varies between competitions |
| Goal difference as primary tiebreaker in most leagues | Number of promoted/relegated teams differs by level |
| Position determined first by points, then by tiebreakers | Head-to-head versus goal difference priority in some leagues |
| Matches played determines total fixture count | Playoff formats for promotion vary by league |
League Tables Beyond Football
While this guide focuses on football, league table systems apply across numerous competitive sports including rugby, cricket, basketball, and baseball. The underlying principles of points allocation and standings remain consistent, though specific tiebreaker rules adapt to each sport’s scoring characteristics.
Non-sports applications include academic rankings, business performance tables, and gaming leaderboards. The Melbourne Renegades vs Hobart Hurricanes Match Scorecard demonstrates how cricket employs similar statistical frameworks for tracking team performance across individual matches and seasonal standings.
Comparing league tables across different sports requires understanding each sport’s unique scoring system. Basketball points-per-game statistics function differently from football goal differences, despite sharing similar ranking principles.
Official Rules and Governing Bodies
League table calculations follow standardized rules established by governing bodies. The FIFA digital hub provides access to regulations that influence how member associations structure their competitions.
The Laws of the Game maintained by The FA establish baseline requirements for competitive integrity, while individual league handbooks specify exact procedures for table calculations and tiebreaker applications.
The Premier League official table serves as an authoritative reference for one of the world’s most-watched competitions, demonstrating how professional leagues implement these standards in practice.
Summary
League tables provide the essential framework for understanding competitive football standings worldwide. The three-point win system, goal difference calculations, and tiered tiebreaker rules work together to create fair, transparent rankings that determine championships, European qualification, and relegation outcomes.
Whether following the Premier League or exploring other competitions, the same fundamental principles apply. Fans who understand how to read these tables gain deeper appreciation for the strategic complexities that unfold across a season.
For those interested in broader financial markets alongside sporting analytics, the Bitcoin Price Chart – Live Price, History and Trends provides real-time market tracking similar to how sports platforms update league standings after each result.
Frequently Asked Questions
What happens if teams finish with exactly equal points?
When teams share equal points, the league applies a tiebreaker hierarchy. Goal difference comes first, followed by total goals scored, then head-to-head results between the tied teams, and finally away goals in head-to-head fixtures.
Are league tables only used in football?
No. League table systems appear across many sports including rugby, cricket, basketball, and baseball. Each sport adapts the framework to its specific scoring characteristics while maintaining the core ranking principles.
What does GD mean in a league table?
GD stands for Goal Difference, calculated by subtracting goals conceded from goals scored. A positive GD indicates more goals scored than conceded, while negative GD shows the opposite. Goal difference serves as the primary tiebreaker when teams level on points.
Why do league tables update throughout matchdays?
League tables update match-by-match as results become final. Different teams play at various times during a matchday, causing positions to shift as new information becomes available. This dynamic nature keeps tables active until all scheduled fixtures conclude.
How many teams typically appear in a league table?
Premier League tables show 20 teams, the Championship displays 24, and lower English Football League tiers also feature 24 teams. The structure varies by competition, with some leagues operating with fewer teams for logistical reasons.
What determines European qualification spots?
In the Premier League, the top four positions qualify for the UEFA Champions League, while fifth place typically enters the Europa League. These positions depend entirely on final league table standings after all matches complete.
Can league table positions change after the season ends?
Once the final matchday concludes and all results are officially confirmed, final standings become locked. Post-season events such as disciplinary hearings or competition re-structures occasionally affect historical records but do not alter completed season outcomes.
Related stories





Sarah McKenzie is Managing Editor at Coast Monitor, overseeing daily newsroom workflow, commissioning and headline review.